Velocity measures how many points your team prints, and your team owns the printer.
The chart went up. The product didn't.
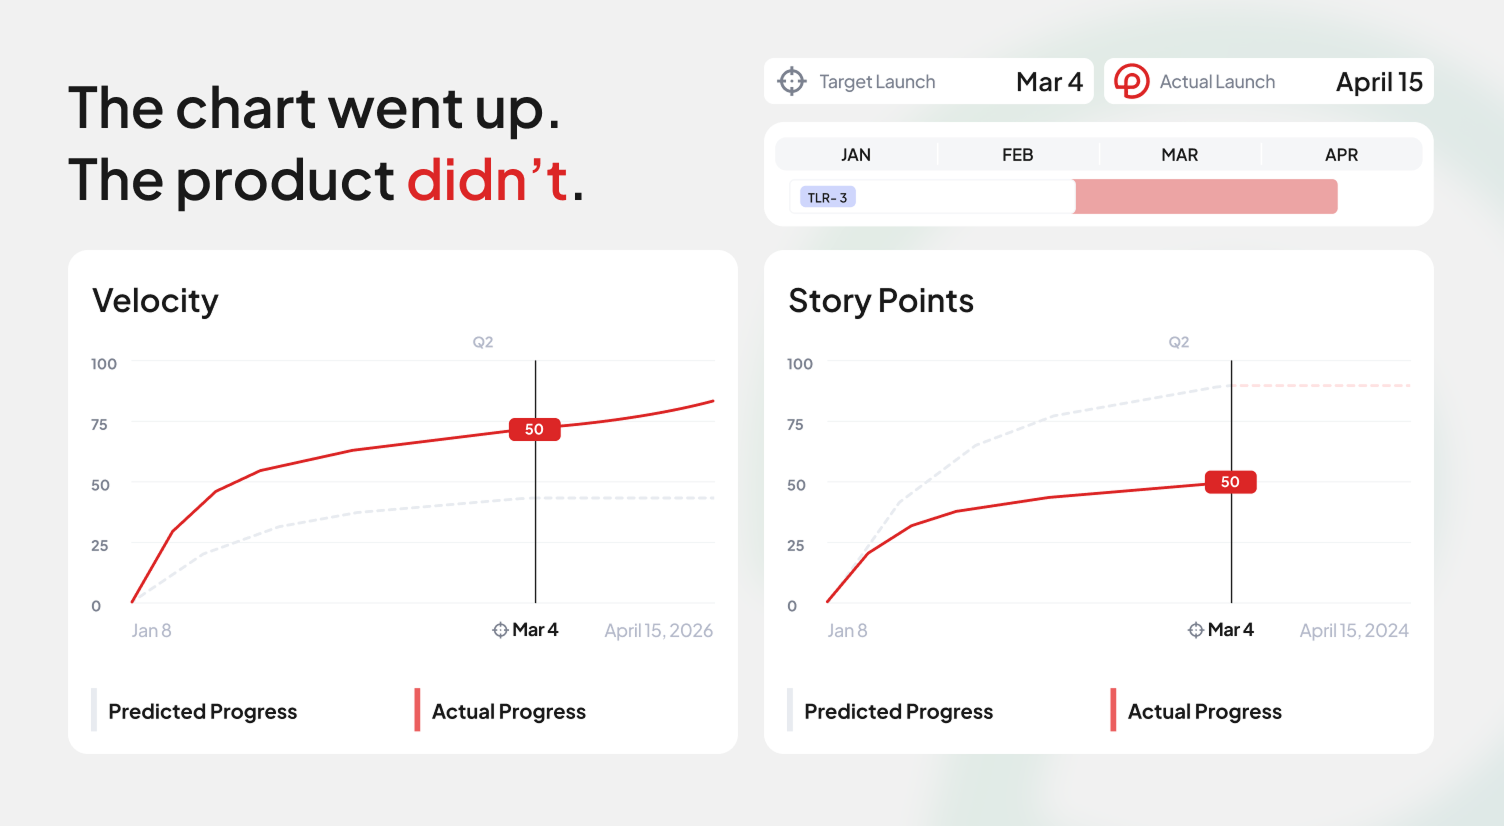
You've sat through this review. The slide shows velocity climbing across the quarter, call it 42 to 55, and everyone nods, because a line going up is what good looks like. Meanwhile the launch that was supposed to land in March is a June launch now, the same two features have rolled through four sprints, and the customer who asked for the export button in January is still asking. Nobody has to cheat for it to happen. Every point on the slide was earned under the rules. That's the injustice: the rules award improvement to a team that shipped the same amount, and the one PM who says "but nothing came out the other end" sounds like she's attacking her own engineers.
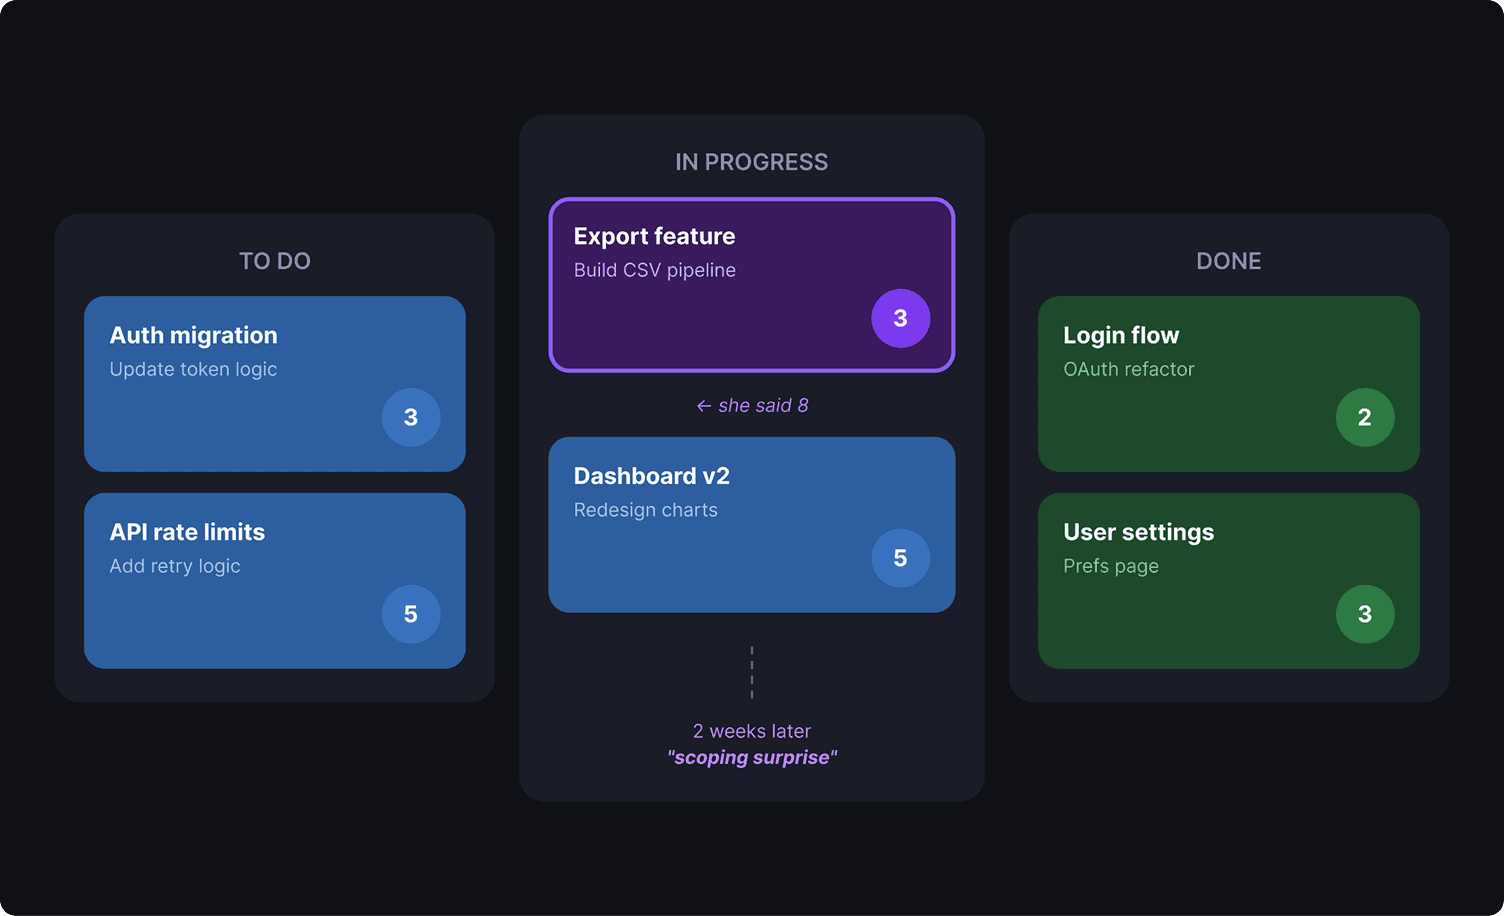
The mechanism is old. Velocity is denominated in a currency the team itself issues. A point has no external referent; it's worth whatever the room said it was worth during planning, and the room is staffed by the people the number will later judge. Pay anyone in a currency they print and you get inflation. Nobody has to cheat for it to happen. Estimates round up when a sprint feels risky, big tickets get split into smaller ones that sum to more than the original, half-finished work rolls over and gets counted again on landing, and the story that would've been a 3 last year is a 5 now because 5s stopped raising eyebrows. Each move is defensible on its own. The sum of defensible moves is a chart that only knows how to go up.
So here's the test, and it takes an afternoon. Pull the last six months. Plot points completed per sprint next to something the team can't print: the count of features that reached customers, or support issues closed by shipped code. If the two lines rise and fall together, your velocity is honest and you can stop reading. I'd bet money they don't. I'd bet the points line drifts upward while the shipping line stays roughly flat, because the gap between them is what the printer produces. If your chart passes, send it to me and I'll publish it with an apology attached.
The standard defense says velocity is a capacity tool, a way of guessing how much fits in the next sprint, and was never meant to be read as a score. That defense is half right, and the half matters: for a stable team doing familiar work, a rolling average of recent throughput is a fair forecast of near-term throughput. The problem starts the moment the number lands on a dashboard someone outside the team can see. Goodhart's law is older than agile: when a measure becomes a target, it stops measuring. A forecast you're being graded on stops being a forecast, and a forecast denominated in a currency you print was never going to survive grading.
The replacement is free. Count finished tickets per sprint for the last twenty sprints and forecast the next one from that distribution; plain throughput predicts about as well as points do, and a ticket either shipped or it didn't. For the early warning, watch for tickets aging past your usual cycle time. If the team likes points for talking through a story in planning, keep them, but keep them in the room. A number that leaves the room becomes a performance review on the way out the door.
Which explains why velocity survives. It's useful to everyone except the roadmap. It hands a manager a number that travels upward without translation, and it gives the team a shield, because "we hit our velocity" ends a harder conversation about whether the right things shipped. A metric both sides benefit from inflating is close to unkillable. Velocity is a peace treaty with a y-axis, and peace treaties outlast the wars they end.
Run the two-line chart before your next quarterly review. Worst case, you walk in holding the only slide in the deck that can't be argued with. And if you want to skip the points debate entirely, Prdikt converts your requirements into sprint-ready plans automatically, no velocity required. Try it at prdikt.com.